Linkyfi vs Google Covid-19 Mobility Report
COVID-19’s impact has been catastrophic. It has made everyday life more challenging as people struggle to strike a balance between ensuring personal safety and their livelihoods. And for businesses, it’s proven an equally tough time. With stringent lockdown measures imposed across the globe, many brands are left without any idea of when they’ll be able to return to business, let alone business as usual.
But the story of how COVID-19 is playing out for retailers, and public spaces is one that can be told with data. In this blog post, we’re exploring insights gathered from across the globe. We’ll be examining data that indicates the behaviour of consumers in airports, shopping malls, supermarkets and other public areas.
Understanding Retail Mobility
Our data has been collected using the same methodology to that of Google’s COVID-19 Mobility Report. We’ve gathered data according to the same date range, verticals and parts of the globe. We’ve also compared and presented our findings in relation to an established baseline, thereby showing clear increases and decreases in activity.
Our data, however, highlights a few benefits that Linkyfi customers get to experience. While Google’s report is based on region or a type of venue, Linkyfi is able to offer more. This includes specific venues and the numbers of shoppers visiting a venue on specific days.
While Linkyfi is capable of providing an hourly distribution of visits, and more, the scope of this report extends to trends that develop over time for specific venues.
You’ll note a correlation between Google and Linkyfi data. Where Google data provides an aggregate of visits to types of venues, Linkyfi shows specific volumes of visitors for a venue. Some graphs include data from as early as January 6th, 2020 and run to March 28th, 2020.
Data presented uses a baseline with graphs reflecting changes in consumer behaviour over time as a percentage.
Linkyfi vs Google Covid-19 Mobility Report
While it’s to be expected that COVID-19 has led to fewer visits to shopping malls, retail outlets and public areas, we’ve extended our report to correlate another vital piece of information: infection rates per country.
Comparing these data sets will show how consumer behaviour has been affected during the pandemic, providing a much clearer picture of how different countries and venues have been impacted. Along with each graph, we’ll share insights that may indicate how consumer behaviour may have been influenced.
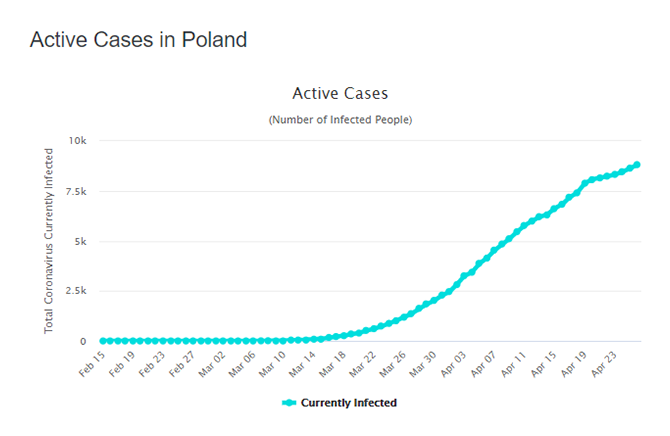
Poland
Country Infection Rate
- Date of first reported infection: March 4, 2020
- Date of rapid infection increase: March 24, 2020 (152 infections in a day)
- Number of reported infections by March 28, 2020: 1638
- Country lockdown date: March 13, 2020

Google’s Graph
Linkyfi WiFi Venues Examined:

Supermarket #1

Supermarket #2

Coffee Shop Chain

Shopping Mall #1

Shopping Mall #2
While lockdown was announced on March 15, 2020, we found that foot traffic began to wane from mid-February. Spikes in store visits are likely due to people returning to outlets or essential items. We noted larger declines, between 64% and 100%, in foot traffic across verticals, compared to Google’s aggregated 78%.
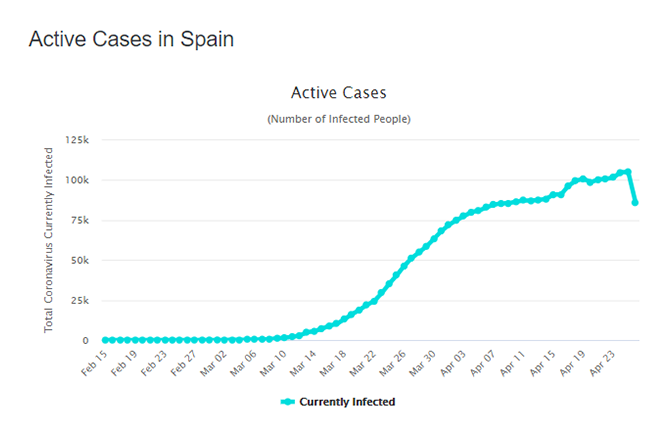
Spain
Country Infection Rate
- Date of first reported infection: February 24, 2020
- Date of rapid infection increase: March 9, 2020 (557 infections in a day)
- Number of reported infections by March 28, 2020: 73 235
- Country lockdown date: March 10, 2020

Google’s Graph
Linkyfi WiFi Venues Examined:

Shops

Google’s Graph

Park

Park Tenerife
Google’s Retail and Recreation graphs show slight movement between February 16 and March 8, however, we noticed the beginnings of fewer visits to retail outlets in Spain. As imagined, news of COVID-19 spreading became more popular, prompting fewer visits to stores.
Parks were more affected than retail outlets. For retailers, the largest decline took place on March 3, seven days before Spain was officially placed on lockdown, where parks began to see a sharp decrease in visitors from mid-February. In comparison, we saw decreases in activity range between 77% to 91.30%, where Google reports a 94% drop for retail and recreational venues and a decrease of 89% for parks.
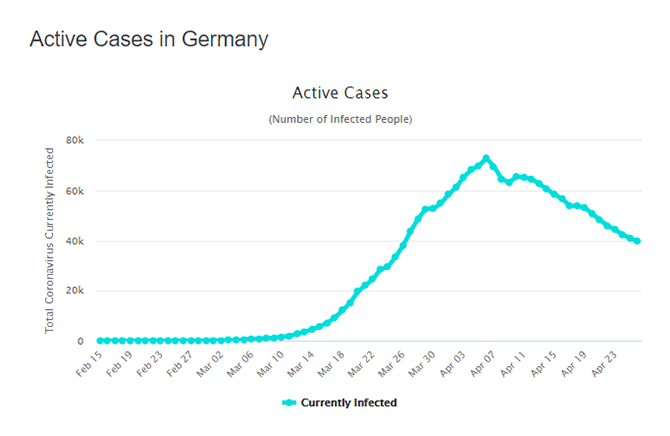
Germany
Country Infection Rate
- Date of first reported infection: February 15, 2020
- Date of rapid infection increase: March 17, 2020 (2095 infections in a day)
- Number of reported infections by March 28, 2020: 57 695
- Country lockdown date: March 22, 2020

Google’s Graph
Linkyfi WiFi Venues Examined:

Shopping Mall
Germany recorded its first COVID-19 case on February 15. While lockdown was only officially imposed on March 22, February 22 (a Saturday) shows an explosion of traffic, almost 150% more than what a local shopping mall received. Like many countries following the pandemic, we surmise that news of the potential effect of the virus on daily living led to panic buying across many malls in Germany. Linkify reports a 96.07% drop in activity, where Google shows a decrease of 77%.
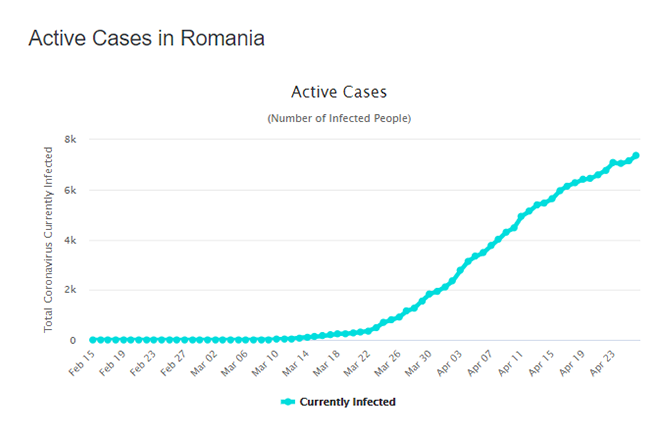
Romania
Country Infection Rate
- Date of first reported infection: February 26, 2020
- Date of rapid infection increase: March 24, 2020 (218 infections in a day)
- Number of reported infections by March 28, 2020: 1452
- Country lockdown date: March 25, 2020

Google’s Graph
Linkyfi WiFi Venues Examined:

Airport
Romania’s first COVD-19 case was reported towards the end of February. While much of Europe also began to see cases of the virus appear, Romania’s airports saw as much as a 25% decrease in visitors. This number grew between the 27th of February and March 5th. We surmise the spike in activity to be related to visitors leaving the country as more information became available about the effects of COVID-19. Romania officially imposed tighter restrictions on its airports and borders on March 21, 2020. Google reports a 72% decline in activity, where we found a 94.34 drop in visits to the airport.
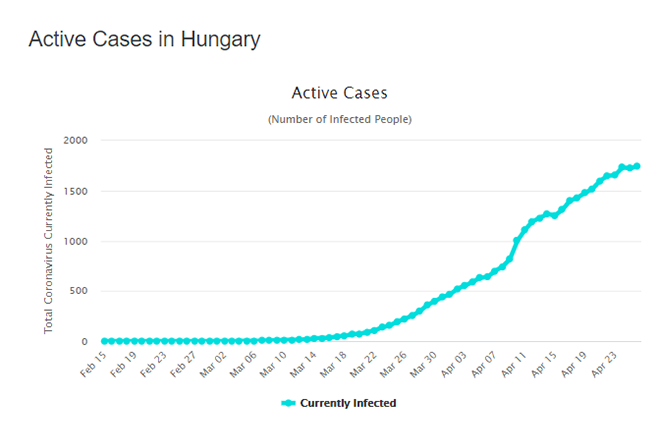
Hungary
Country Infection Rate
- Date of first reported infection: March 4,2020
- Date of rapid infection increase: March 20, 2020 (3 infections in a day)
- Number of reported infections by March 28, 2020: 298
- Country lockdown date: March 11, 2020.

Google’s Graph
Linkyfi WiFi Venues Examined:

MAV Railways
Hungary reported its first coronavirus case on March 4 and later entered a state-wide lockdown on March 11. Lockdown has led to their national railway system usage prohibited, causing a dramatic decline in rail usage from March 11, 2020. Google recorded a 53% fall in transit station visits, where our data shows a 92.48% decline.
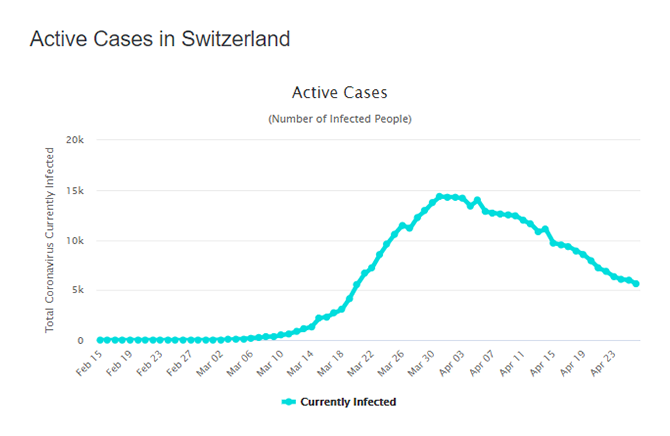
Switzerland
Country Infection Rate
- Date of first reported infection: February 25, 2020
- Date of rapid infection increase: March 15, 2020 (842 infections in a day)
- Number of reported infections by March 28, 2020: 14 076
- Country lockdown date: March 16, 2020

Google’s Graph
Linkyfi WiFi Venues Examined:

City Centre
Switzerland’s first coronavirus case emerged on February 25, making them one of the first countries in Europe to record an infection. While infections continued to rise, with one of the highest infection case days being March 15, a city centre recorded a moderate volume of visitors. Switzerland officially entered lockdown status on March 16, after which we observed a large decline in foot traffic. Google identified an 81% drop in retail and recreational activity, where we noted an 87.92% decline in city centre visits.
Italy
Country Infection Rate
- Date of first reported infection: February 15, 2020
- Date of rapid infection increase: March 9, 2020 (1797 infections in a day)
- Number of reported infections by March 28, 2020: 92 472
- Country lockdown date: March 11, 2020


Google’s Graph
Linkyfi WiFi Venues Examined:

Restaurants
Italy has one of the highest infection and fatality rates in the world. With the news of coronavirus and its ability to spread gaining moments, Italy saw a sharp decline in restaurant patrons towards the last week of February. Italy’s Prime Minister imposed a national quarantine on March 11, 2020. Google indicated a 94% drop in retail and recreational activity, where we spotted a 100% drop in restaurant visits.
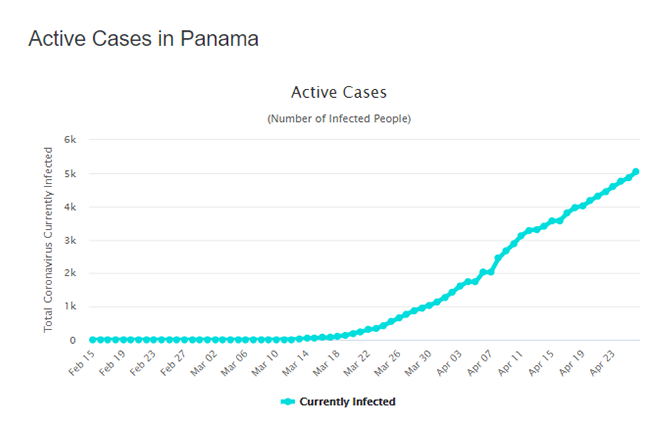
Panama
Country Infection Rate
- Date of first reported infection: March 10, 2020
- Date of rapid infection increase: March 24, 2020 (28 infections in a day)
- Number of reported infections by March 28, 2020: 901
- Country lockdown date: April 11, 2020

Google’s Graph
Linkyfi WiFi Venues Examined:

Bus Stops
Public transport is used by many Panamanians. Buses are a popular means of getting to and from work and school, as seen above. This changed as COVID-19 news reached the South American country. A state of emergency was declared on March 13 and lockdown on April 11. Google shows a decline of 77% in transit station activity, where we identified a 93.72% fall in bus station visits.
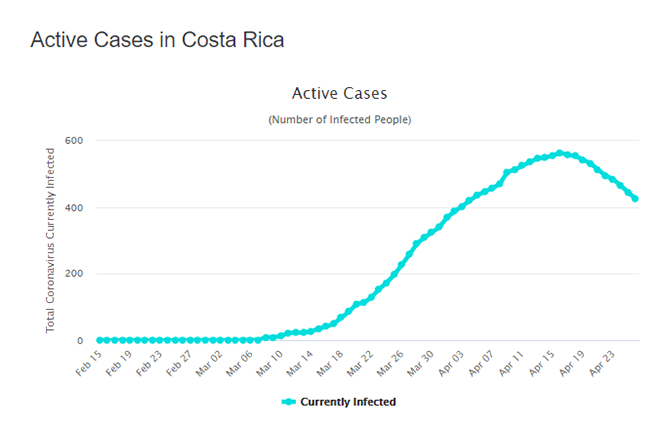
Costa Rica
Country Infection Rate
- Date of first reported infection: March 5, 2020
- Date of rapid infection increase: March 18, 2020 (19 infections in a day)
- Number of reported infections by March 28, 2020: 295
- Country lockdown date: March 18, 2020

Google’s Graph
Linkyfi WiFi Venues Examined:

Park
Parks in Costa Rica attract large crowds, with as many as 23 thousand visitors taking to outdoor activities at certain locations. While parks experienced relatively busy periods from mid-February to mid-March, numbers changed soon after. Our data shows that swift intervention and a national lockdown has been an effective measure for decreasing the spread of the virus. From March 21, parks saw just over 50% fewer visitors. Google saw a 71% decrease in park visits, where we noted a fall of 97.79%.
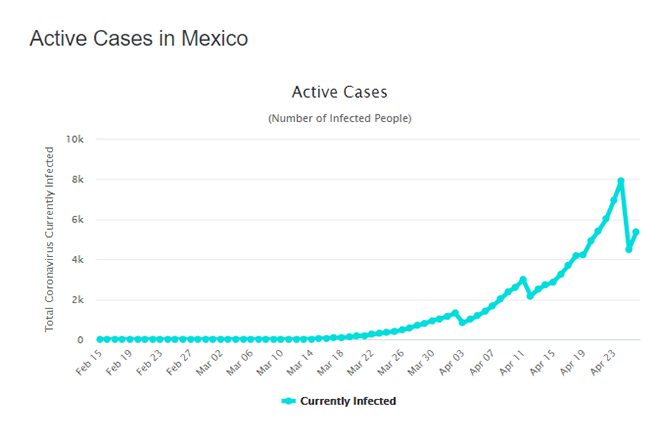
Mexico
Country Infection Rate
- Date of first reported infection: February 28, 2020
- Date of rapid infection increase: March 27, 2020 (110 infections in a day)
- Number of reported infections by March 28, 2020: 848
- Country lockdown date: April 2, 2020

Google’s Graph
Linkyfi WiFi Venues Examined:

Park
Mexico’s first coronavirus case was reported on February 28. Since then, the country’s response to the pandemic has led to lockdown measures implemented from April 2. As infections grew over the month of March, it’s evident that fewer people chose to spend time in parks. Google saw a 46% decline in park activity, where we identified a drop of 99.36%.
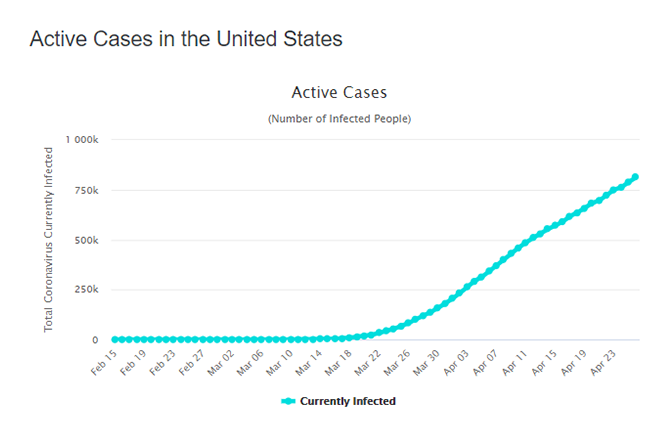
USA
Country Infection Rate
- Date of first reported infection: February 15, 2020
- Date of rapid infection increase: March 22, 2020 (9422 infections in a day)
- Number of reported infections by March 28, 2020: 124 788
- Country lockdown date: Mid-March

Google’s Graph

Google’s Graph
Linkyfi WiFi Venues Examined:

City Centre
The United States, like Italy, has seen a growing number of infections in March. Our data indicates that a generally lower percentage of foot traffic was experienced. A sharp spike was recorded on March 9. We surmise that this increase in city-centre traffic was related to pressure mounting as news of the virus grew, leading to panic shopping and hastened travel before the nationwide lockdown was imposed. Google reported 59% and 42% decrease in retail and recreational and workplace activity, respectively. Our data indicated a fall of 99% within the city centre.
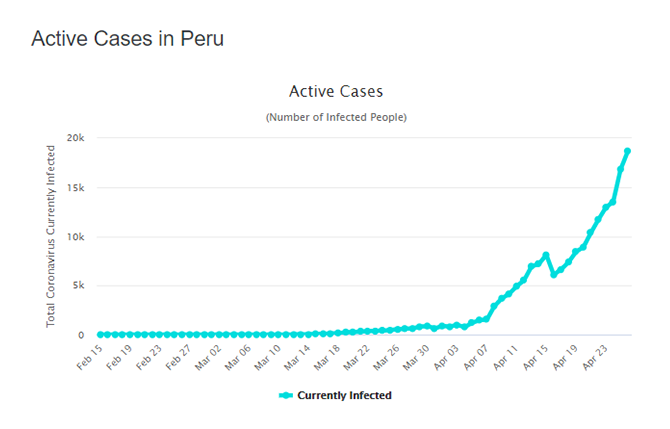
Peru
Country Infection Rate
- Date of first reported infection: March 6, 2020
- Date of rapid infection increase: March 19, 2020 (89 infections in a day)
- Number of reported infections by March 28, 2020: 671
- Country lockdown date: March 15, 2020

Google’s Graph
Linkyfi WiFi Venues Examined:

Food Chain
Peru’s earliest infection was recorded on March 6. This prompted a quick response from the government, leading to a nationwide lockdown that commenced on March 15. While we’ve noted a generally lower number of visitors to the food chain, there’s a marked decrease from March 15. Google reported an 82% decrease in retail and recreational activity, where we saw a lower fall to 99.28% at a food chain.
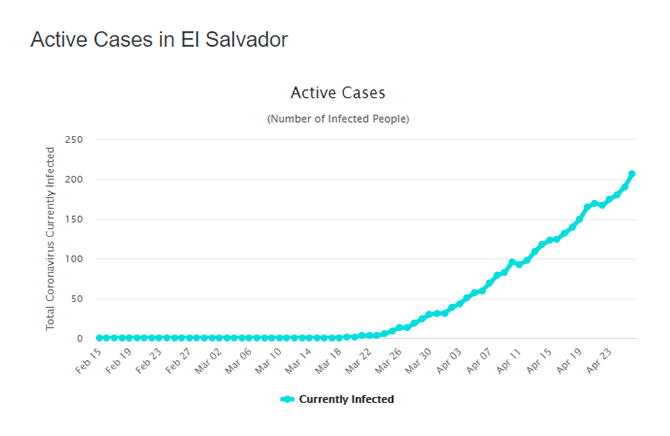
El Salvador
Country Infection Rate
- Date of first reported infection: March 19, 2020
- Date of rapid infection increase: March 25, 2020 (4 infections in a day)
- Number of reported infections by March 28, 2020: 19
- Country lockdown date: March 22, 2020

Google’s Graph
Linkyfi WiFi Venues Examined:

Shopping Mall

Food Chain
Like other countries, data hints at the impact of news about coronavirus and its influence on the public. El Salvador experienced its first infection on March 19. As data shows, much of the traffic to shopping outlets and a food chain began to lessen from March 15, seven days before a nationwide lockdown was imposed. Google recorded a retail and recreational activity decline of 81%, where we saw shopping mall visits drop by 97.42% and food chain traffic slow by 97.85%.
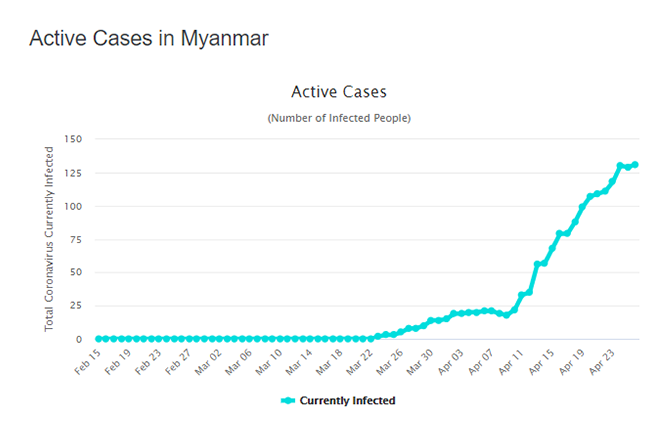
Myanmar
Country Infection Rate
- Date of first reported infection: March 23, 2020
- Date of rapid infection increase: March 27, 2020 (3 infections in a day)
- Number of reported infections by March 28, 2020: 8
- Country lockdown date: April 12, 2020

Google’s Graph
Linkyfi WiFi Venues Examined:

Shopping Mall
Myanmar shopping malls typically see more foot traffic during the weekend. As seen above, spikes on February 22 and March 13, being Saturday and Sunday, respectively show an increase in visits to a local shopping mall.
While we also noticed a sharp decline on Tuesday, March 3, there isn’t conclusive evidence to determine the cause of the sudden decrease in shoppers and this event could simply be an anomaly. Myanmar officially went on lockdown on April 12. What’s notable is that fewer visits were recorded almost a month before. Google documented a 46% drop in retail and recreational activity, where our data shows a 60.15% decline in visits to a local shopping mall.
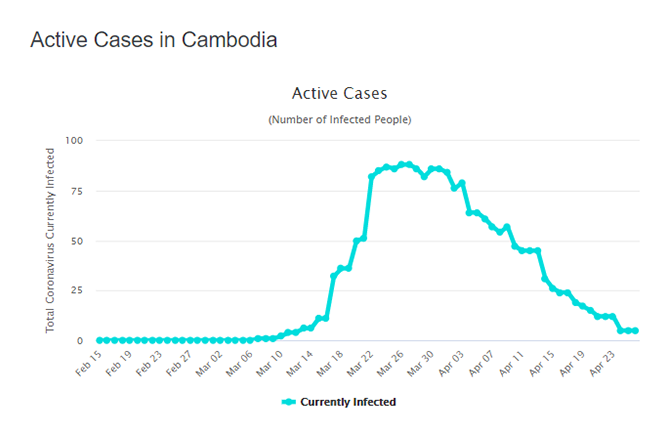
Cambodia
Country Infection Rate
- Date of first reported infection: March 8, 2020
- Date of rapid infection increase: March 17, 2020 (21 infections in a day)
- Number of reported infections by March 28, 2020: 99
- Country lockdown date: April 9, 2020

Google’s Graph
Linkyfi WiFi Venues Examined:

Restaurant Chain
Cambodia has been able to successfully decrease the number of coronavirus infections since its first on March 8. This effort was largely due to the closing of borders with neighbouring states, Vietnam and Laos. Since the beginning of Cambodia’s fight against the virus, we recorded fewer visits to a popular restaurant chain. A sudden decline on March 3 (a Tuesday) also hints at the effect of news about the virus and how it spreads. Thereafter, we saw a gradual decrease leading up to the end of March. Google noted a 43% slowdown in retail and recreational activity, where our data indicates a 53.30% decline of visits to a local restaurant chain.
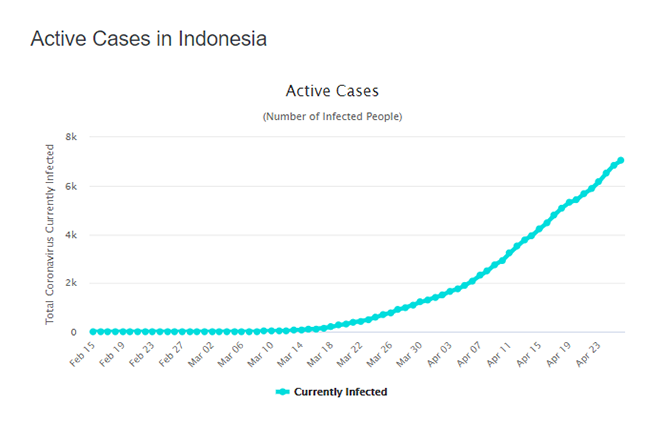
Indonesia
Country Infection Rate
- Date of first reported infection: March 2, 2020
- Date of rapid infection increase: March 27, 2020 (153 infections in a day)
- Number of reported infections by March 28, 2020: 1155
- Country lockdown date: April 10, 2020

Google’s Graph
Linkyfi WiFi Venues Examined:

Shopping Mall

Retail
Indonesia displayed a much more drastic response to COVID-19. The Southeast Asia and Oceania-based country caught wind of their first infection on March 2, causing an almost 60% decline in visits to a retail outlet and a shopping mall. Indonesia went under lockdown on April 10. Google saw a 47% decrease in retail and recreational activity, where we noticed 54.77% and 50.84% decreases in visits to a local retail outlet and a shopping mall.
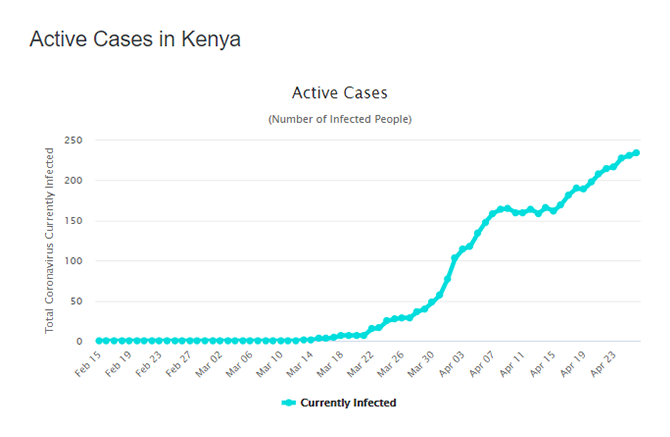
Kenya
Country Infection Rate
- Date of first reported infection: March 13, 2020
- Date of rapid infection increase: April 2, 2020 (29 infections in a day)
- Number of reported infections by March 28, 2020: 38
- Country lockdown date: April 6, 2020

Google’s Graph
Linkyfi WiFi Venues Examined:

Shopping Mall
Like much of Africa, Kenya’s first cases of COVID-19 were diagnosed in early March. In Kenya’s case, their first recorded infection was confirmed on March 13, but the data tells an interesting story. A sharp decline in shopping mall visits on March 3 (a Tuesday), ten days before the first recorded case, points to a potential inflection point, something we think could be tied to mounting concerns about the virus as news of it spreading across the globe grew in popularity.
On March 26, the shopping mall received a noticeable influx of shoppers. The rise could be attributed to government workers receiving salaries on the 15 of each month, while private employees are paid towards the end of the month. As infections in Kenya grew towards the end of March, we also noticed a decrease in shopping mall visits. Google showed a 45% decline in retail and recreational activity, where we saw a 31.08% fall in visits to a shopping mall.
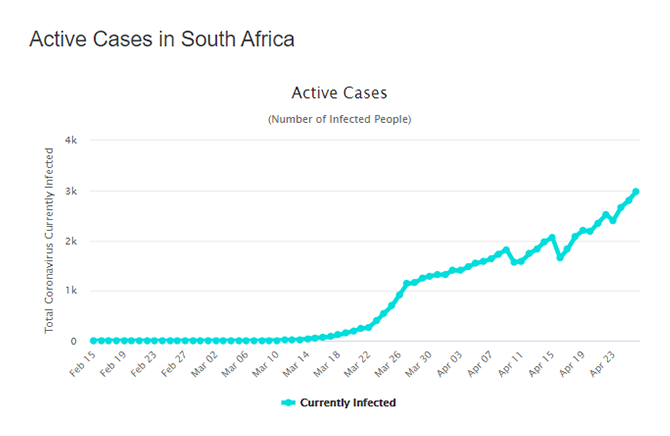
South Africa
Country Infection Rate
- Date of first reported infection: March 6, 2020
- Date of rapid infection increase: March 28, 2020 (218 infections in a day)
- Number of reported infections by March 28, 2020: 1187
- Country lockdown date: March 27, 2020

Google’s Graph
Linkyfi WiFi Venues Examined:

Airports

Google's graph

Shopping Mall
South Africa’s first coronavirus case was discovered on March 6. While the country went on lockdown on March 27, and a national state of emergency was declared on March 15. Data shows a sudden increase in shopping mall visits, that are a result of panic buying. Google reported a drop of 79% and 80% for retail and recreational venues and transit stations, respectively. We noted a decline of 76.89% and 100%.
Conclusion
While the coronavirus has had far-reaching effects, the extent of the damage can only be quantified through data. Linkyfi proves that collecting and analyzing data on consumer behaviour makes it easier to understand how various events, even so unpredictable as a pandemic, can be distilled into actionable intelligence.
Recommended posts
- WiFi for Stadiums Explained
- Guest WiFi - Easter Marketing with AI: A Step-by-Step Guide
- Guest WiFi + AI: Your Marketing Dream Team!
Subscribe to stay in the loop with all our latest content:
Recommended posts