Comparing Google Community Mobility Report with Linkyfi's WiFi-based data
As the coronavirus pandemic sweeps across the globe, the need for accurate data grows. In response, Google has published its COVID-19 Community Mobility Report. The report lends insights into how policies for managing the spread of the virus have impacted communities. These insights explore community movement trends according to geographies and span various categories, such as retail & recreation, grocery & pharmacy, residential properties, workplaces and more.
The report compared traffic in public places for 131 countries. Reports for each country are available on a page fully accessible to everyone. You can find out, among other things, how people’s mobility has changed in recent weeks and whether the number of people visiting stores and pharmacies, parks or workplaces has increased or decreased in a given region.
With more than one billion people using Google Maps to navigate the places they live or travel, one would expect Google data to be the most precise in the world. The report, however, not only raised a great number of legal/privacy concerns but is also being accused of inaccuracy. AVSystem decided to compare Google’s results with data collected by Linkyfi using the same methodology.
Linkyfi insights
Linkyfi is a sophisticated WiFi analytics platform. With its use, we’ve gathered data according to the same date range, verticals and parts of the globe. We’ve also compared and presented our findings in relation to an established baseline, thereby showing clear increases and decreases in activity.
Our data, however, highlights a few benefits that Linkyfi customers get to experience. While Google’s report is based on region or a type of venue, Linkyfi is able to offer more. This includes specific venues and the numbers of shoppers visiting a venue on specific days.
What’s more, while Linkyfi is capable of providing an hourly distribution of visits, and more, the scope of this report extends to trends that develop over time for specific venues.
And finally, where Google data provides an aggregate of visits to types of venues, Linkyfi shows specific volumes of visitors for a venue. Take a look at this example from retail & recreation during the COVID-19 pandemic in Poland.
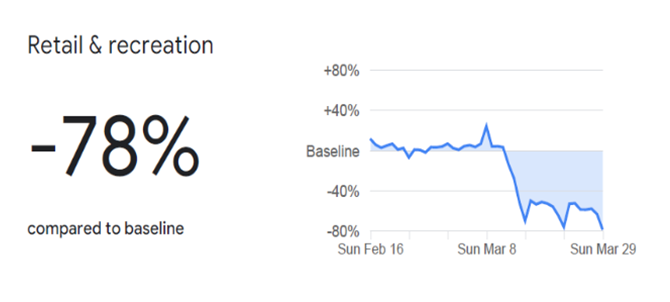
Google's graph
Linkyfi WiFi Venues Examined:
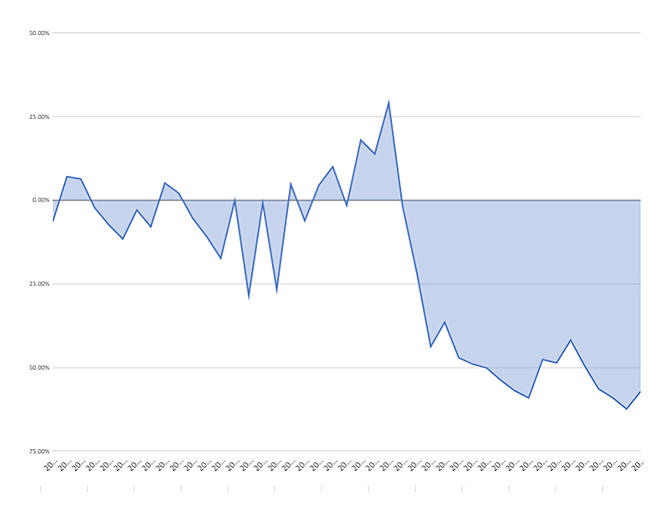
Supermarket #1
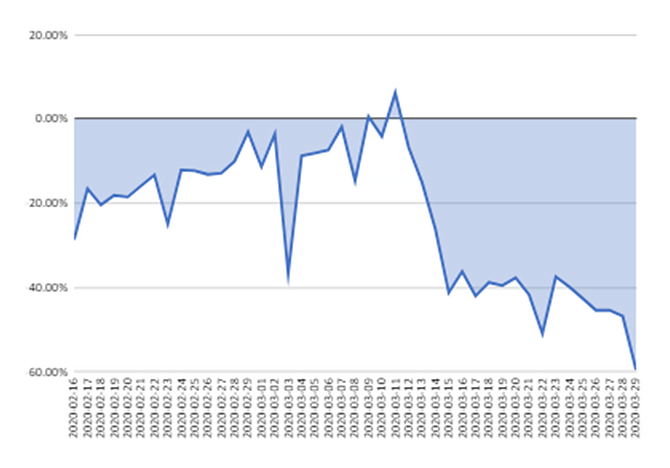
Supermarket #2
Our observations confirmed that Google’s data is sound but Linkyfi is capable of tracking traffic in greater detail. While lockdown in Poland was announced on March 15th, 2020, we found that foot traffic began to wane from mid-February. Spikes in store visits are likely due to people returning to outlets or essential items. We noted larger declines, between 64% and 100%, in foot traffic across verticals, compared to Google’s aggregated 78%.
Greater detail
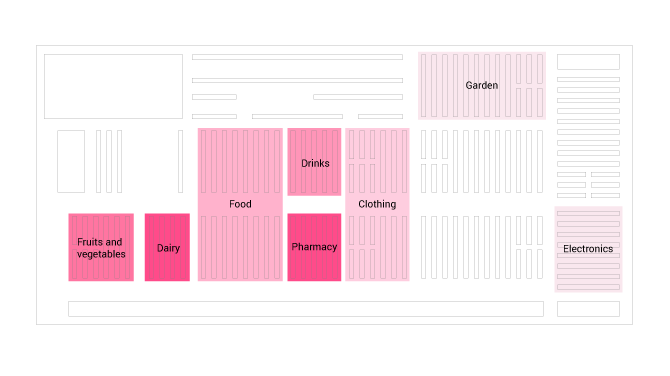
Linkify’s capabilities don’t stop there. Unlike Google, it's also capable of providing in-building analytics to help businesses optimise their layouts for operational efficiency. A closer look at in-store shopper behaviour for a supermarket in Poland shows how the dairy, perfume, pharmacy departments received the most visits during the early days of COVID-19. With these insights, the supermarket could ensure that stock levels. It could also consider grouping complementary products often purchased together with those from these departments to drive revenue and limit shoppers from spending more time in public spaces.
In addition to in-building analytics, Linkify can be used during COVID-19 to:
- Accurately determine people counts in-store, an important safeguard to ensure social distancing and limited contact in stores.
- Identify and manage dwell-time of shoppers during a crisis and normal conditions.
- Flatten hourly customers distribution to optimize resources and reduce queues.
Introducing the Linkyfi vs Google Covid-19 Mobility Report
Operational efficiency can be challenging to maintain, especially in the midst of a pandemic. Check the full Linkyfi mobility report covering data gathered from specific businesses and WiFi-enabled locations in countries across the globe.
The report indicates how buyer behaviour has been influenced, showing the effects of COVID-19 on a micro-scale, and is also correlated with coronavirus-related news for each country.
Recommended posts
- WiFi for Stadiums Explained
- Guest WiFi - Easter Marketing with AI: A Step-by-Step Guide
- Guest WiFi + AI: Your Marketing Dream Team!
Subscribe to stay in the loop with all our latest content:
Recommended posts