Streaming framework for large-scale data monitoring with Kafka Streams – general overview
In order to achieve our mission-critical goal—efficient retrieval of meaningful information—we are constantly making our best effort to provide customers with tools facilitating comprehension of their internal processes and enabling them to pursue business growth.
According to R.W. Hamming, 20th-century American mathematician, who claimed that the purpose of computation is insight, not numbers, our fundamental objective is to elaborate understandable and reliable metrics of service quality evaluation. Therefore, we have decided to build a system raising valuable awareness, resulting consequently in measurable business profit. This has been achieved by operating on raw data records contributing to a big-picture, holistic view of an organization. The benefits of extensive, multilevel analysis for the telco industry range from trivial ones, such as discovering customer infrastructure misconfiguration, through supervising the status of provided services, to undertaking proactive steps once a threat is identified by dedicated predictive models and outlier detection algorithms in order to prevent the observed systems from breakdown.
To reach already outlined points, numerous crucial requirements, in terms of both quality and performance, need to be met:
- primarily, data processing results computed by the monitoring system have to be credible and easily interpretable in order to provide unambiguous insight into the observed system for each user,
- furthermore, the solution is expected to be used in heterogeneous IoT environments, thus it should be sufficiently generic to handle multiple types of input devices and data formats, as well as highly configurable to fit customer-specific infrastructures,
- finally, the aforementioned quality indicators are possible to be fulfilled only if the Monitoring Component architecture is scalable and fault-tolerant.
Set your goals high, and don’t stop till you get there
Since the very beginning, we were focused on defining a particular set of goals we wanted to achieve by introducing the Monitoring Component. Minimizing the hardware resources needed for the development stage was one of those. At the same time, we were centered on ensuring the minimal differences between the production and development environments to reduce the risk of unexpected failures in production.
Considering the data being processed in a distributed manner (separated into multiple processing workers located presumably on different machines in the same network), it was also essential to manage late arrival of events (e.g. caused by network latency). Whenever distributed programming is employed, fault tolerance sooner or later becomes the case. Network or hardware defects usually cause unexpected worker failures and as soon as one of the workers can no longer process the stream, this should become available to be reprocessed by another running instance of the application. Since we agreed on seamless configuration of both the data model and the processing formula, enabling automatic recovery after reconfiguration was also the case. Time-windowing operations support was also required to easily create compressed time-series output and ensure aggregates results smoothing.
On the other hand, there was no need for a standalone high-performance processing cluster with self-contained streaming computations available to be deployed using resource managers (waving our hands to the Apache Flink), although we could have used some of its features, e.g. distributed execution coordination, load balancing and fault tolerance. Batch processing was also never the requirement since we were focused on stream processing, as opposed to working on data that have already been stored for a period of time.
All aforementioned considerations led to an undeniable need for a streaming framework or library combining the simplicity of creation and deployment of the applications on the client side with the scalability, fault tolerance and—undoubtedly—performance.
Kafka Streams to the rescue
Kafka Streams is a part of the official Apache Kafka project since the 0.10 version, yet it already proved itself to be one of the most seamless solutions when it comes to creating custom real-time streaming applications. Since it is built on top of the Kafka’s storage and messaging layers, the Streams library combines Kafka’s most demanded features: heritage with API simplicity and low entry level for the developers (having even basic Kafka architecture knowledge).
Heading to the more technical side, one may ask why exactly we had used this library and which features were crucial in our case. The answer for both of the questions would be, certainly, the stateful aggregation.
The part that we want to focus on is that—thanks to the stateful operations (more precisely count(), reduce() and aggregate())—we can successfully reduce the number of output events and perform intermediate computation proactively in real-time. Note that stateless operations transform one currently processed event to zero or more, but cannot combine multiple events into a single one. As for the proactive versus reactive approach—in the mass monitoring era, response overhead caused by aggregating hundreds of thousands of messages on request is often unacceptable. Chunks of monitoring data have to be combined in order to be presented immediately.
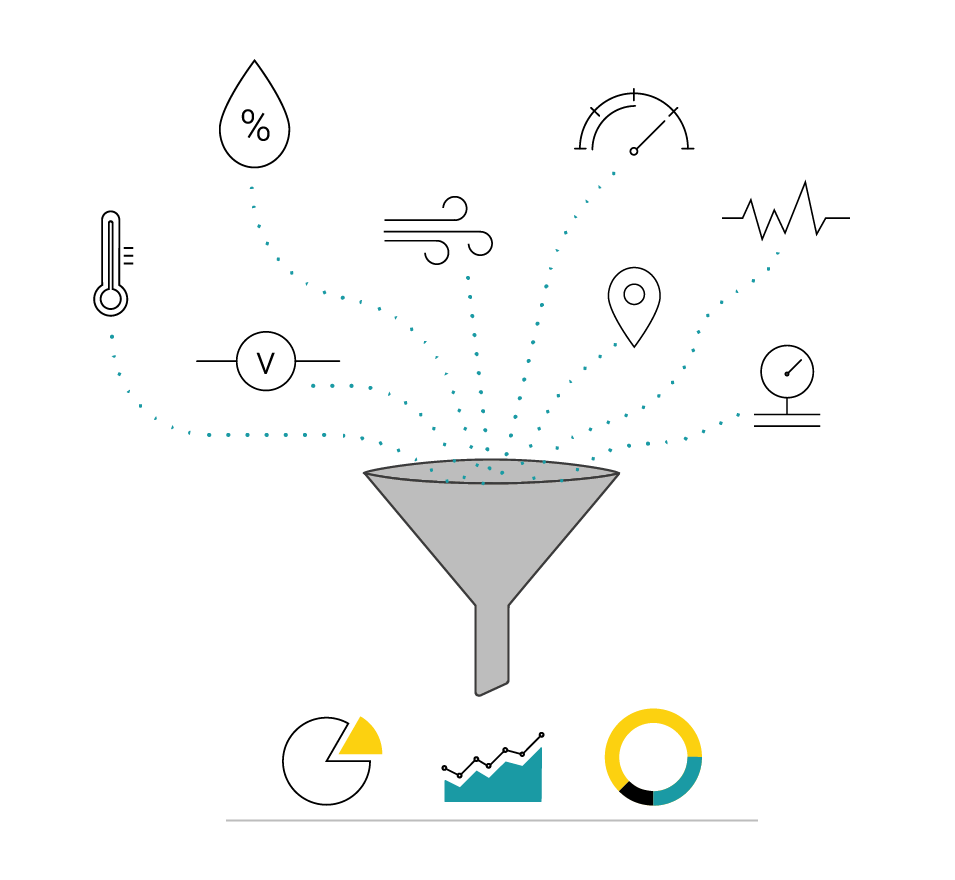
So, which metrics precisely can we present to our customers? Starting from the simple minimum, maximum (also in terms of event time—assuring most recent values even in case of late events arrival), count or sum, through the well known to the statistics 101 course attendees: standard deviation, a variety of averages, percentiles, and custom metrics based on the internal business logic.
All of the aforesaid aggregation methods take advantage of the Kafka Streams windowing semantics. Windowed aggregates are configured via the following windowing parameters:
- window size (length of the time window);
- window interval (interval between consecutive window beginnings);
- window grace period (this one is especially important when late events—which were produced on-time, but arrived when the window size time was up—need to be handled equivalently. Combined with window size, grace period may be understood as a window Time to Live, after which all of the late events will be discarded).
Fig. 1 presents a stream of events grouped by the record key and processed in a windowed stream where window interval value is smaller than window duration. Note that the very same event lands in multiple windows.
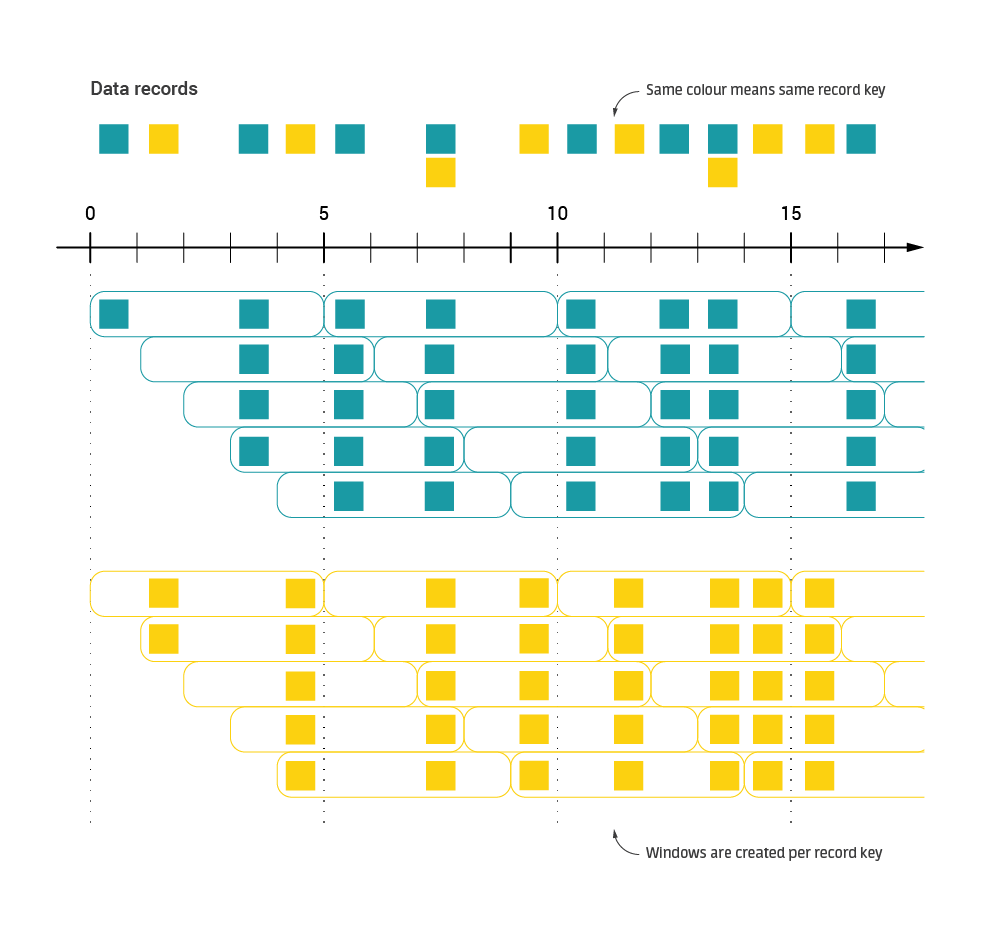
Fig. 1. Simple time-windowed stream example. In this case, window duration is equal to 5 minutes, with 1-minute interval.
Architecture overview
Enabling the Monitoring Component to operate in heterogeneous IoT environments naturally requires the establishment of a common input data representation. Therefore we have decided to employ one of AVSystem’s flagship products—the Unified Device Management Platform (UMP)—in three ways:
- as a protocol hub integrating numerous devices available through multiple communication standards—a few of such are presented in Fig. 2;
- for data parsing into a uniform format;
- for sending unified messages to an event bus for further processing.
Furthermore, textual records of the well-known structure pass through the event bus (built with Kafka in this case) to the Monitoring Component, which consumes input messages. These are processed in a streaming manner by the monitoring engine in order to compute appropriate aggregates, then finally stored in a database and available for querying for external applications, especially those providing graphical interfaces. We have decided to choose the MongoDB database because of both simple, non-transactional persistence model with insignificant redundancy and out-of-the-box interoperability with other components and their communication standards.
After all, it should be emphasized that both performance and reliability of this architecture may be managed by horizontal scaling since all the four aforementioned components (primarily UMP and Monitoring Component) support clusterization.
The process described above is precisely depicted in Fig. 2.
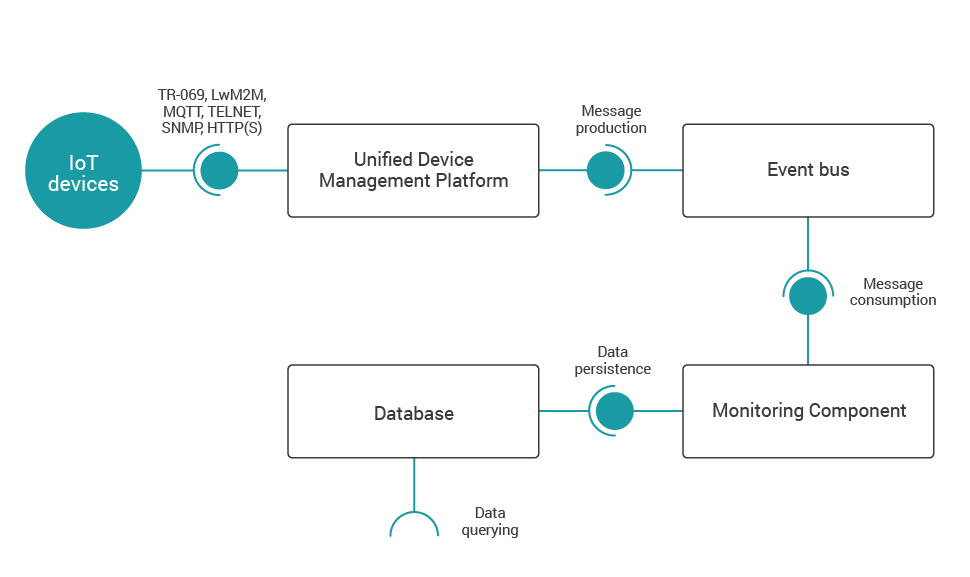
Fig. 2. Component diagram of a typical architecture for large-scale data monitoring.
Streaming framework internals
Making one step from the top-level architecture description towards the Monitoring Component details, consider Fig. 3 presenting a flow of single input record through the data processing engine.
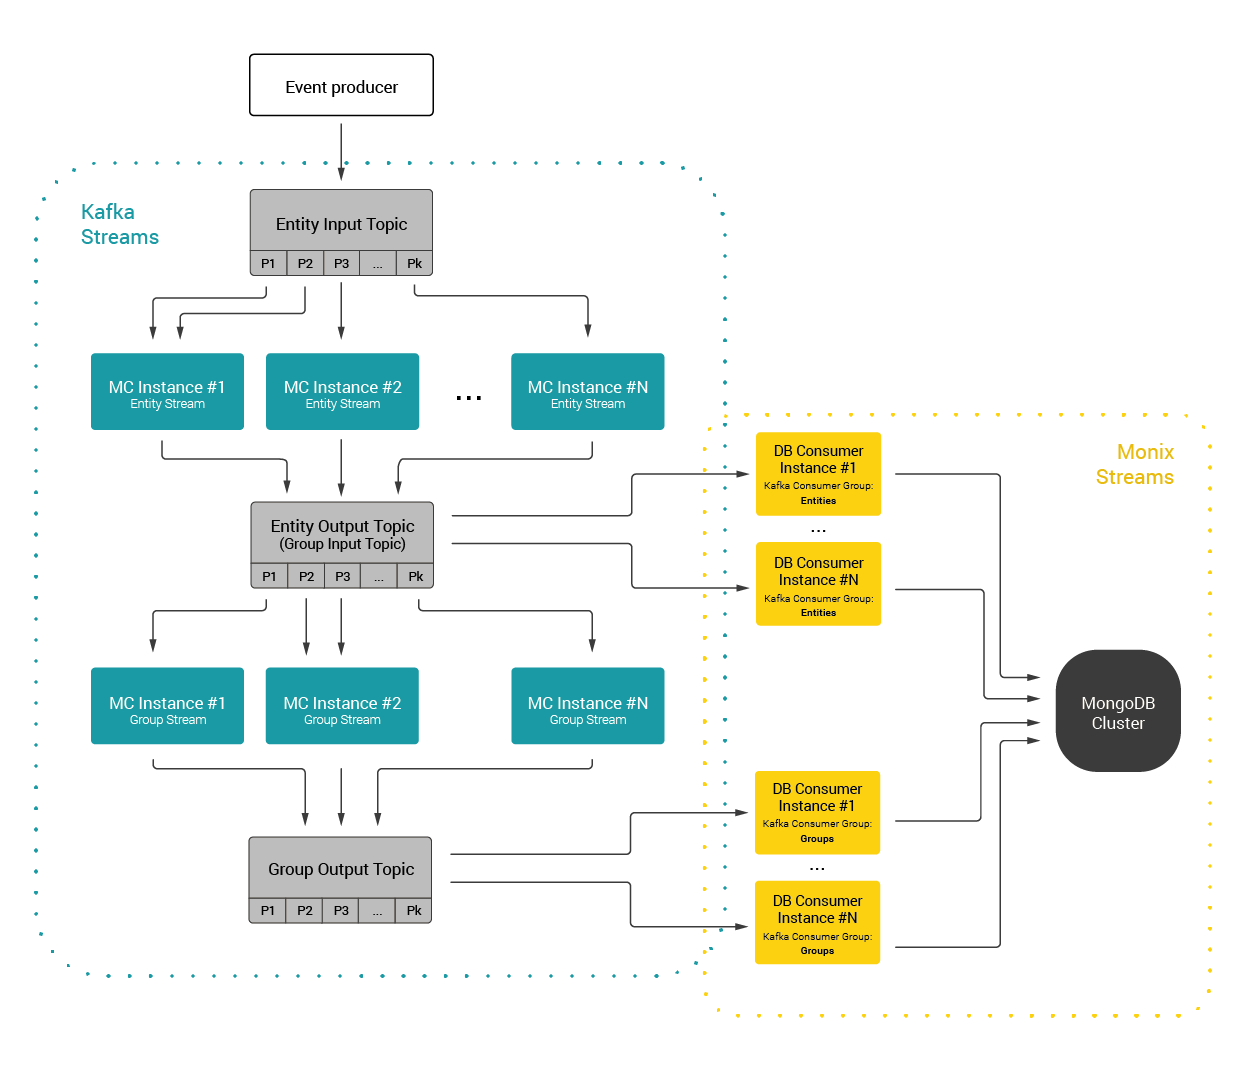
Fig. 3. Data flow diagram of the Monitoring Component.
At its core, the Monitoring Component is a tool for collecting, processing and persisting numerical and textual data. Those may come from various entities and their only requirement is to consist of unique ID. Input events are grouped by the ID and then aggregated in a configurable way as a windowed entity stream.
Describing the event flow, the producer feeds the information provided in the form of partial events (containing only a single information, e.g. one parameter value) with normalized data to the input Kafka topic, which is the starting point of the Monitoring Component.
The first step of the event processing is sampling. Any parameter values referring to the monitored entity have to be separated into multiple events keyed by the entity ID. Those may be considered to be the input for the entity stream of the Monitoring Component like depicted in Fig. 4.
{
"id": "GT#4202137",
"parameter": "CurrentDownstream",
"value": {
"eventTimeMillis": 1548081433725,
"value": 2137.0
}
}
Fig. 4. Input event for the entity stream.
Depending on the aggregates and tracked parameters configuration for the entities, specific output is going to be produced periodically for each active time window. This is at the same time input for the group streams. Both entity and group stream outputs are consumed and persisted in the database as time-series results.
As an example, consider an aggregate producing the most recently processed value for each parameter of the aggregated entity within single time window. We simply call it "Last Value". Then, each aggregation result is represented in our streaming topology by an event residing at the entity stream output topic. Structure of such an event for the "Last Value" aggregate is given by Fig. 5.
{
"id": GT#4202137",
"paramsValues": {
"ParamsLastValues": {
"CurrentTechnology": {
"eventTimeMillis": 1548081433729,
"value": "ADSL"
},
"OperationalStatus": {
"eventTimeMillis": 1548081433727,
"value": "Up"
},
"CurrentDownstream": {
"eventTimeMillis": 1548081433725,
"value": 2137.0
}
}
},
"windowBoundaries": {
"startTimeMs": 1548075600000,
"endTimeMs": 1548082800000
}
}
Fig. 5. Entity stream output event.
Monitored results may also be available to view in the form of group aggregates. Groups may be seen as any kind of the association of the entities (e.g. geographic region). The core issue for the group monitoring case is to compute and visualize aggregated values reliably. In order to provide it, numerous streaming techniques are used.
Keep an eye out for more
In this article we have introduced the Monitoring Component—generic, streaming data processing engine designed for IoT devices supervision. We have presented its genesis and expected goals based on crucial business and technical requirements, reflected by comprehensive analysis of both the Kafka Streams backed solution architecture as well as its typical use cases. But that’s not all! In the next chapter of our story we are going to provide you with deep insight into streaming data processing semantics (such as windowing), as well as discuss numerous approaches to produce credible and meaningful aggregation results, also in terms of groups. Stay tuned!
Recommended posts
- Configuring TR-069 ACS on Your Device and Connecting It to the ACS Server
- Announcing support for Cellular connection in Anjay ESP32 Client
- Rethinking IoT security with PSA
Subscribe to stay in the loop with all our latest content:
Recommended posts